5 Loops en R. Funciones base de R
(‘“Looping”, “cycling”, “iterating” or just replicating instructions’)
Trabajaremos con conjunto de datos llamada iris, la base tiene información sobre el largo y ancho de sépalos y pétalos de 50 flores de tres especies de plantas.
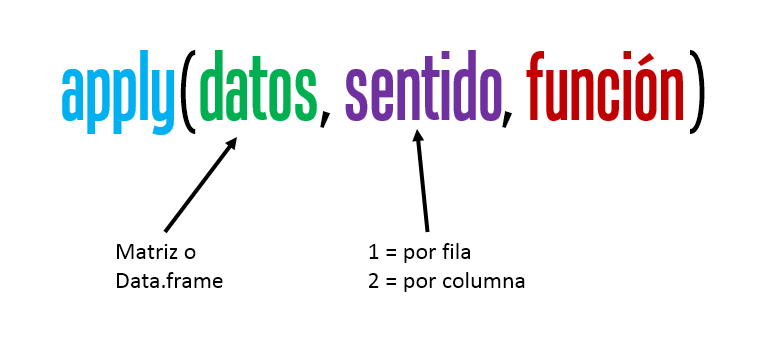
5.1 apply()
Aplicas instrucciones a filas o columnas de un data.frame o matriz.
Si queremos estimar la media de cada una de mis cuatro variables de la tabla iris entonces podría usar lo siguiente:
mean(iris$Sepal.Length)
#> [1] 5.843333

mean(iris$Sepal.Width)
#> [1] 3.057333

mean(iris$Petal.Length)
#> [1] 3.758

mean(iris$Petal.Width)
#> [1] 1.199333
o
c(mean(iris$Sepal.Length), mean(iris$Sepal.Width), mean(iris$Petal.Length), mean(iris$Petal.Width))
#> [1] 5.843333 3.057333 3.758000 1.199333
oo
colMeans(iris[,1:4])
#> Sepal.Length  Sepal.Width Petal.Length  Petal.Width
#>     5.843333     3.057333     3.758000     1.199333
Pero podríamos usar apply()
apply(iris, 2, mean)
#> Warning in mean.default(newX[, i], ...): argument is not
#> numeric or logical: returning NA

#> Warning in mean.default(newX[, i], ...): argument is not
#> numeric or logical: returning NA

#> Warning in mean.default(newX[, i], ...): argument is not
#> numeric or logical: returning NA

#> Warning in mean.default(newX[, i], ...): argument is not
#> numeric or logical: returning NA

#> Warning in mean.default(newX[, i], ...): argument is not
#> numeric or logical: returning NA
#> Sepal.Length  Sepal.Width Petal.Length  Petal.Width
#>           NA           NA           NA           NA
#>      Species
#>           NA
¿Porqué sale error o NA?
Para ir tomando ritmo resolvamos los siguientes ejercicios:
1) Ahora quiero la raíz cuadrada de la media que previamente es elevada a la 5ta potencia
apply(iris[,1:4], 2, function(x){
  x.1 <- sqrt(mean(x)^5)
})
#> Sepal.Length  Sepal.Width Petal.Length  Petal.Width
#>    82.537565    16.343948    27.377383     1.575251
2) El resultado de la raíz cuadrada la quiero multiplicar por 15 y dividir entre 2
3) Si el resultado es mayor a 1000 que devuelva un 0
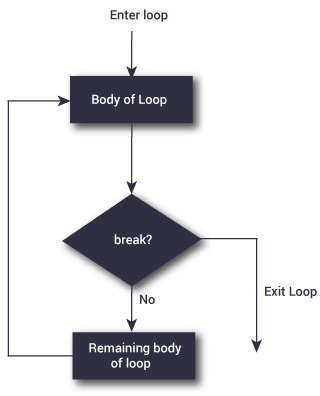
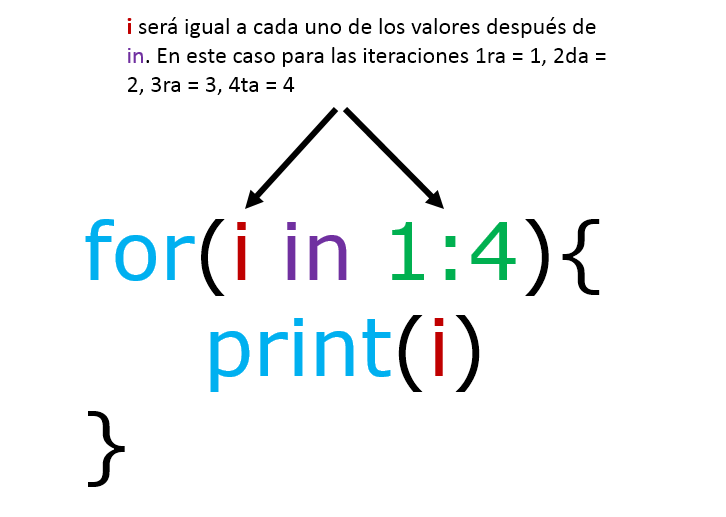
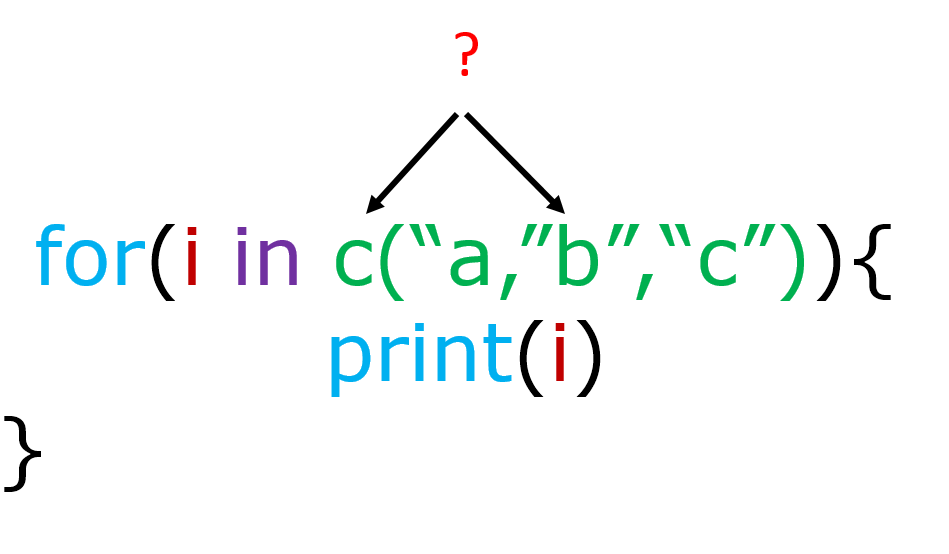
5.2 for()
Sirve para repetir n veces una o más instrucciones. La estructura es:
En el siguiente ejemplo usaremos for() para obtener un boxplot para cada variable de pétalo y sépalo.
Solución 1.
par(mfrow=c(2,2))
boxplot(iris$Sepal.Length ~ iris$Species, ylab = "Sepal.Length",
        xlab = "Specie")
boxplot(iris$Sepal.Width ~ iris$Species, ylab = "Sepal.Width",
        xlab = "Specie")
boxplot(iris$Petal.Length ~ iris$Species, ylab = "Petal.Length",
        xlab = "Specie")
boxplot(iris$Petal.Width ~ iris$Species, ylab = "Petal.Width",
        xlab = "Specie")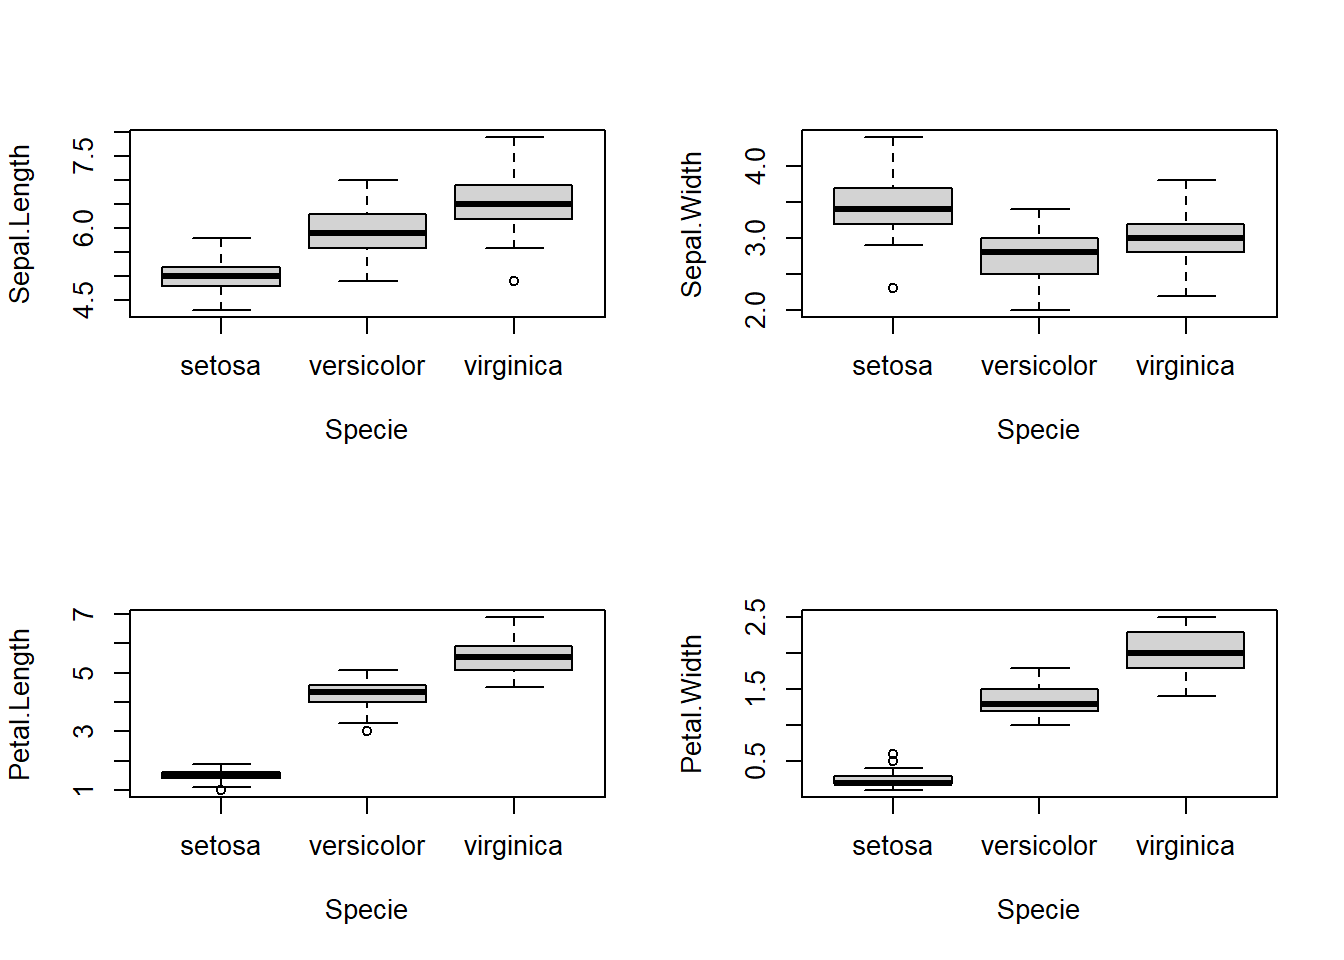
Solución 2.
par(mfrow=c(2,2))
for(i in 1:4){
  boxplot(iris[[i]] ~ iris$Species, ylab = names(iris)[i], xlab = "Specie")
}
Además, podemos crear vectores, listas o data.frames, pero previamente debemos crear un objeto que va a almacenar nuestra salida de cada iteración (repetición de instrucciones) y que debe tener las propiedades que queremos de salida.
Vector
prueba <- vector()
for(i in 1:4){
  prueba[[i]] <- mean(iris[[i]])
}
prueba
#> [1] 5.843333 3.057333 3.758000 1.199333
Data.frame
prueba <- data.frame(Especie = "",
                     "MSepal.Length" = 0,
                     "SDSepal.Length" = 0)
prueba
#>   Especie MSepal.Length SDSepal.Length
#> 1                     0              0
# c("setosa", "versicolor", "virginica") = unique(iris$Species)
for(i in 1:3){
  i.1 <- iris[iris$Species == unique(iris$Species)[[i]],]
  prueba[i,] <- data.frame(Especie = as.character(unique(iris$Species)[[i]]),
                     "MSepal.Length" = mean(i.1$Sepal.Length),
                     "SDSepal.Length" = sd(i.1$Sepal.Length))
}
prueba
#>      Especie MSepal.Length SDSepal.Length
#> 1     setosa         5.006      0.3524897
#> 2 versicolor         5.936      0.5161711
#> 3  virginica         6.588      0.6358796
Lista
prueba <- list()
# c("setosa", "versicolor", "virginica") = unique(iris$Species)
for(i in 1:3){
  i.1 <- iris[iris$Species == unique(iris$Species)[[i]],]
  prueba[[i]] <- data.frame(Especie = as.character(unique(iris$Species)[[i]]),
                     "MSepal.Length" = mean(i.1$Sepal.Length),
                     "SDSepal.Length" = sd(i.1$Sepal.Length))
}
prueba
#> [[1]]
#>   Especie MSepal.Length SDSepal.Length
#> 1  setosa         5.006      0.3524897
#>
#> [[2]]
#>      Especie MSepal.Length SDSepal.Length
#> 1 versicolor         5.936      0.5161711
#>
#> [[3]]
#>     Especie MSepal.Length SDSepal.Length
#> 1 virginica         6.588      0.6358796
Para colapsar la lista en un unico objeto podemos usar la función do.call()
prueba <- do.call(rbind, prueba)
prueba
#>      Especie MSepal.Length SDSepal.Length
#> 1     setosa         5.006      0.3524897
#> 2 versicolor         5.936      0.5161711
#> 3  virginica         6.588      0.6358796
5.3 sapply()
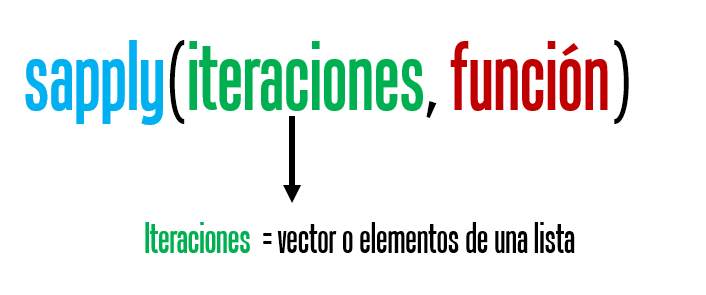
sapply trabaja con vectores o listas y las salidas usuales pueden ser matrices, con varios array, una lista o un vector, es decir, puede hacer de todo!
Veamos algunas de sus aplicaciones más comunes.
1. Obtener un vector numérico. Estimar la media para cada variable del conjunto de datos iris.
2. Obtener una matriz con arrays que puedes transformar a data.frame. Ojo el resultado de iteración lo agrega en una “columna”.
sapply(1:3, function(x){
  x.1 <- iris[iris$Species == unique(iris$Species)[[x]],]
  x.1 <- c("Especie" = as.character(unique(iris$Species)[[x]]),
           "MSepal.Length" = mean(x.1$Sepal.Length),
           "SDSepal.Length" = sd(x.1$Sepal.Length))
  return(x.1)
})
#>                [,1]                [,2]
#> Especie        "setosa"            "versicolor"
#> MSepal.Length  "5.006"             "5.936"
#> SDSepal.Length "0.352489687213451" "0.516171147063863"
#>                [,3]
#> Especie        "virginica"
#> MSepal.Length  "6.588"
#> SDSepal.Length "0.635879593274432"
Si quiero tener una salida más amigable como un data.frame tendríamos que usar otras funciones, por ejemplo:
library(magrittr)# para usar %>%
sapply(1:3, function(x){
  x.1 <- iris[iris$Species == unique(iris$Species)[[x]],]
  x.1 <- c("Especie" = as.character(unique(iris$Species)[[x]]),
           "MSepal.Length" = mean(x.1$Sepal.Length),
           "SDSepal.Length" = sd(x.1$Sepal.Length))
  return(x.1)
}) %>% as.data.frame() %>% t() %>% as.data.frame()
#>       Especie MSepal.Length    SDSepal.Length
#> V1     setosa         5.006 0.352489687213451
#> V2 versicolor         5.936 0.516171147063863
#> V3  virginica         6.588 0.635879593274432
3. Obtener una lista. Se necesita que las salidas tengan dimensiones distintas, de lo contrario lo juntara en una matriz.
sapply(3:9, seq)
#> [[1]]
#> [1] 1 2 3
#>
#> [[2]]
#> [1] 1 2 3 4
#>
#> [[3]]
#> [1] 1 2 3 4 5
#>
#> [[4]]
#> [1] 1 2 3 4 5 6
#>
#> [[5]]
#> [1] 1 2 3 4 5 6 7
#>
#> [[6]]
#> [1] 1 2 3 4 5 6 7 8
#>
#> [[7]]
#> [1] 1 2 3 4 5 6 7 8 9
sapply(1:3, function(x){
  x.1 <- iris[iris$Species == unique(iris$Species)[[x]],]
  if(unique(x.1$Species) == "setosa"){
  x.1 <- c("Especie" = as.character(unique(iris$Species)[[x]]),
           "MSepal.Length" = mean(x.1$Sepal.Length))
  } else {
  x.1 <- c("Especie" = as.character(unique(iris$Species)[[x]]),
           "MSepal.Length" = mean(x.1$Sepal.Length),
           "SDSepal.Length" = sd(x.1$Sepal.Length))
  }

  return(x.1)
})
#> [[1]]
#>       Especie MSepal.Length
#>      "setosa"       "5.006"
#>
#> [[2]]
#>             Especie       MSepal.Length      SDSepal.Length
#>        "versicolor"             "5.936" "0.516171147063863"
#>
#> [[3]]
#>             Especie       MSepal.Length      SDSepal.Length
#>         "virginica"             "6.588" "0.635879593274432"
5.4 tapply()
La función tapply() aplica una función a un vector x y agrupa la salida de acuerdo con un vector y del mismo largo. El vector y es categórico e idealmente debe tener distintos niveles de factor.

Ejemplo.
tapply(iris$Sepal.Width, iris$Species, mean)
#>     setosa versicolor  virginica
#>      3.428      2.770      2.974
5.5 mapply()
La función mapply() puede ser usada bajo la misma logica de sapply pero usando más de un vector. Los vectores iteractuan por posición, es decir, el primer elemento del vector y y el vector 2, seguido del segundo elemento del vector 1 y vector 2, etc.

Ejemplos:
mapply(mean, iris$Sepal.Length, iris$Petal.Length)
#>   [1] 5.1 4.9 4.7 4.6 5.0 5.4 4.6 5.0 4.4 4.9 5.4 4.8 4.8
#>  [14] 4.3 5.8 5.7 5.4 5.1 5.7 5.1 5.4 5.1 4.6 5.1 4.8 5.0
#>  [27] 5.0 5.2 5.2 4.7 4.8 5.4 5.2 5.5 4.9 5.0 5.5 4.9 4.4
#>  [40] 5.1 5.0 4.5 4.4 5.0 5.1 4.8 5.1 4.6 5.3 5.0 7.0 6.4
#>  [53] 6.9 5.5 6.5 5.7 6.3 4.9 6.6 5.2 5.0 5.9 6.0 6.1 5.6
#>  [66] 6.7 5.6 5.8 6.2 5.6 5.9 6.1 6.3 6.1 6.4 6.6 6.8 6.7
#>  [79] 6.0 5.7 5.5 5.5 5.8 6.0 5.4 6.0 6.7 6.3 5.6 5.5 5.5
#>  [92] 6.1 5.8 5.0 5.6 5.7 5.7 6.2 5.1 5.7 6.3 5.8 7.1 6.3
#> [105] 6.5 7.6 4.9 7.3 6.7 7.2 6.5 6.4 6.8 5.7 5.8 6.4 6.5
#> [118] 7.7 7.7 6.0 6.9 5.6 7.7 6.3 6.7 7.2 6.2 6.1 6.4 7.2
#> [131] 7.4 7.9 6.4 6.3 6.1 7.7 6.3 6.4 6.0 6.9 6.7 6.9 5.8
#> [144] 6.8 6.7 6.7 6.3 6.5 6.2 5.9

mapply(sum, iris$Sepal.Length, iris$Petal.Length, iris$Sepal.Width)
#>   [1] 10.0  9.3  9.2  9.2 10.0 11.0  9.4  9.9  8.7  9.5 10.6
#>  [12]  9.8  9.2  8.4 11.0 11.6 10.6 10.0 11.2 10.4 10.5 10.3
#>  [23]  9.2 10.1 10.1  9.6 10.0 10.2 10.0  9.5  9.5 10.3 10.8
#>  [34] 11.1  9.5  9.4 10.3  9.9  8.7 10.0  9.8  8.1  8.9 10.1
#>  [45] 10.8  9.2 10.5  9.2 10.5  9.7 14.9 14.1 14.9 11.8 13.9
#>  [56] 13.0 14.3 10.6 14.1 11.8 10.5 13.1 12.2 13.7 12.1 14.2
#>  [67] 13.1 12.6 12.9 12.0 13.9 12.9 13.7 13.6 13.6 14.0 14.4
#>  [78] 14.7 13.4 11.8 11.7 11.6 12.4 13.8 12.9 13.9 14.5 13.0
#>  [89] 12.7 12.0 12.5 13.7 12.4 10.6 12.5 12.9 12.8 13.4 10.6
#> [100] 12.6 15.6 13.6 16.0 14.8 15.3 17.2 11.9 16.5 15.0 16.9
#> [111] 14.8 14.4 15.3 13.2 13.7 14.9 15.0 18.2 17.2 13.2 15.8
#> [122] 13.3 17.2 13.9 15.7 16.4 13.8 14.0 14.8 16.0 16.3 18.1
#> [133] 14.8 14.2 14.3 16.8 15.3 15.0 13.8 15.4 15.4 15.1 13.6
#> [144] 15.9 15.7 14.9 13.8 14.7 15.0 14.0
O podría hacer una función:
f <- function(a,b,c) a+b/c

mapply(f, iris$Sepal.Length, iris$Petal.Length, iris$Sepal.Width)
#>   [1]  5.500000  5.366667  5.106250  5.083871  5.388889
#>   [6]  5.835897  5.011765  5.441176  4.882759  5.383871
#>  [11]  5.805405  5.270588  5.266667  4.666667  6.100000
#>  [16]  6.040909  5.733333  5.500000  6.147368  5.494737
#>  [21]  5.900000  5.505405  4.877778  5.615152  5.358824
#>  [26]  5.533333  5.470588  5.628571  5.611765  5.200000
#>  [31]  5.316129  5.841176  5.565854  5.833333  5.383871
#>  [36]  5.375000  5.871429  5.288889  4.833333  5.541176
#>  [41]  5.371429  5.065217  4.806250  5.457143  5.600000
#>  [46]  5.266667  5.521053  5.037500  5.705405  5.424242
#>  [51]  8.468750  7.806250  8.480645  7.239130  8.142857
#>  [56]  7.307143  7.724242  6.275000  8.186207  6.644444
#>  [61]  6.750000  7.300000  7.818182  7.720690  6.841379
#>  [66]  8.119355  7.100000  7.318519  8.245455  7.160000
#>  [71]  7.400000  7.528571  8.260000  7.778571  7.882759
#>  [76]  8.066667  8.514286  8.366667  7.551724  7.046154
#>  [81]  7.083333  7.041667  7.244444  7.888889  6.900000
#>  [86]  7.323529  8.216129  8.213043  6.966667  7.100000
#>  [91]  7.192308  7.633333  7.338462  6.434783  7.155556
#>  [96]  7.100000  7.148276  7.682759  6.300000  7.164286
#> [101]  8.118182  7.688889  9.066667  8.231034  8.433333
#> [106]  9.800000  6.700000  9.472414  9.020000  8.894444
#> [111]  8.093750  8.362963  8.633333  7.700000  7.621429
#> [116]  8.056250  8.333333  9.463158 10.353846  8.272727
#> [121]  8.681250  7.350000 10.092857  8.114815  8.427273
#> [126]  9.075000  7.914286  7.733333  8.400000  9.133333
#> [131]  9.578571  9.584211  8.400000  8.121429  8.253846
#> [136]  9.733333  7.947059  8.174194  7.600000  8.641935
#> [141]  8.506452  8.545161  7.688889  8.643750  8.427273
#> [146]  8.433333  8.300000  8.233333  7.788235  7.600000
5.6 lapply()
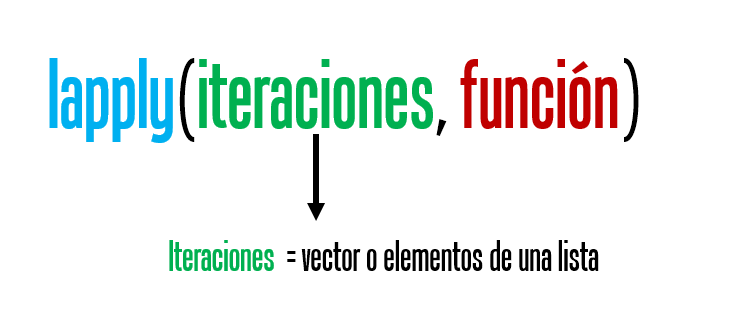
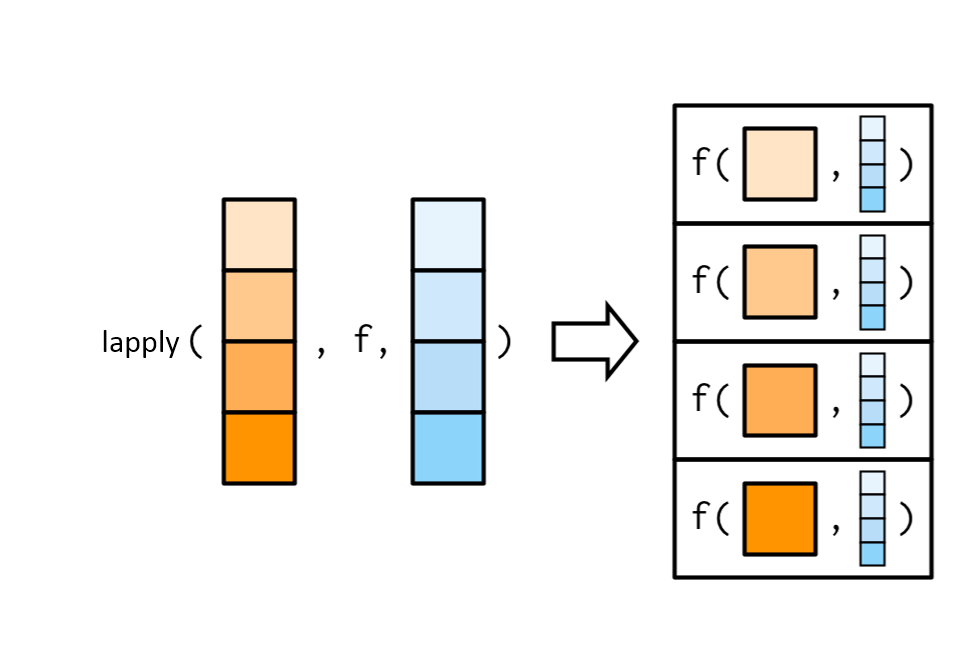
La función lapply es una de las funciones más usadas en R, permite realizar iteraciones sobre una lista, array o vector y devuelve siempre una lista. Esto tiene varias ventajas, por ejemplo, que puedes guardar cualquier tipo clase de R.
Vector
lapply(1:3, function(x){
  x.1 <- iris[iris$Species == unique(iris$Species)[[x]],]

  x.1 <- c("Especie" = as.character(unique(iris$Species)[[x]]),
           "MSepal.Length" = mean(x.1$Sepal.Length),
           "SDSepal.Length" = sd(x.1$Sepal.Length))

  return(x.1)
})
#> [[1]]
#>             Especie       MSepal.Length      SDSepal.Length
#>            "setosa"             "5.006" "0.352489687213451"
#>
#> [[2]]
#>             Especie       MSepal.Length      SDSepal.Length
#>        "versicolor"             "5.936" "0.516171147063863"
#>
#> [[3]]
#>             Especie       MSepal.Length      SDSepal.Length
#>         "virginica"             "6.588" "0.635879593274432"
Data.frame
lapply(1:3, function(x){
  x.1 <- iris[iris$Species == unique(iris$Species)[[x]],]
  x.1 <- data.frame("Especie" = as.character(unique(iris$Species)[[x]]),
           "MSepal.Length" = mean(x.1$Sepal.Length),
           "SDSepal.Length" = sd(x.1$Sepal.Length))

  return(x.1)
})
#> [[1]]
#>   Especie MSepal.Length SDSepal.Length
#> 1  setosa         5.006      0.3524897
#>
#> [[2]]
#>      Especie MSepal.Length SDSepal.Length
#> 1 versicolor         5.936      0.5161711
#>
#> [[3]]
#>     Especie MSepal.Length SDSepal.Length
#> 1 virginica         6.588      0.6358796
Para colapsar la lista en un unico data.frame podemos usar la función do.call()
lapply(1:3, function(x){
  x.1 <- iris[iris$Species == unique(iris$Species)[[x]],]
  x.1 <- data.frame("Especie" = as.character(unique(iris$Species)[[x]]),
           "MSepal.Length" = mean(x.1$Sepal.Length),
           "SDSepal.Length" = sd(x.1$Sepal.Length))

  return(x.1)
}) %>% do.call(rbind, .)
#>      Especie MSepal.Length SDSepal.Length
#> 1     setosa         5.006      0.3524897
#> 2 versicolor         5.936      0.5161711
#> 3  virginica         6.588      0.6358796
lista
lapply(1:3, function(x){
  x.1 <- iris[iris$Species == unique(iris$Species)[[x]],]

  x.1 <- list("Especie" = as.character(unique(iris$Species)[[x]]),
           "MSepal.Length" = mean(x.1$Sepal.Length),
           "SDSepal.Length" = sd(x.1$Sepal.Length))

  return(x.1)
})
#> [[1]]
#> [[1]]$Especie
#> [1] "setosa"
#>
#> [[1]]$MSepal.Length
#> [1] 5.006
#>
#> [[1]]$SDSepal.Length
#> [1] 0.3524897
#>
#>
#> [[2]]
#> [[2]]$Especie
#> [1] "versicolor"
#>
#> [[2]]$MSepal.Length
#> [1] 5.936
#>
#> [[2]]$SDSepal.Length
#> [1] 0.5161711
#>
#>
#> [[3]]
#> [[3]]$Especie
#> [1] "virginica"
#>
#> [[3]]$MSepal.Length
#> [1] 6.588
#>
#> [[3]]$SDSepal.Length
#> [1] 0.6358796